


























Views
Downloads

Essential Grade 4 Rock Cycle Chart | Printable Science
Paste this activity's link or code into your existing LMS (Google Classroom, Canvas, Teams, Schoology, Moodle, etc.).
Students can open and work on the activity right away, with no student login required.
You'll still be able to track student progress and results from your teacher account.
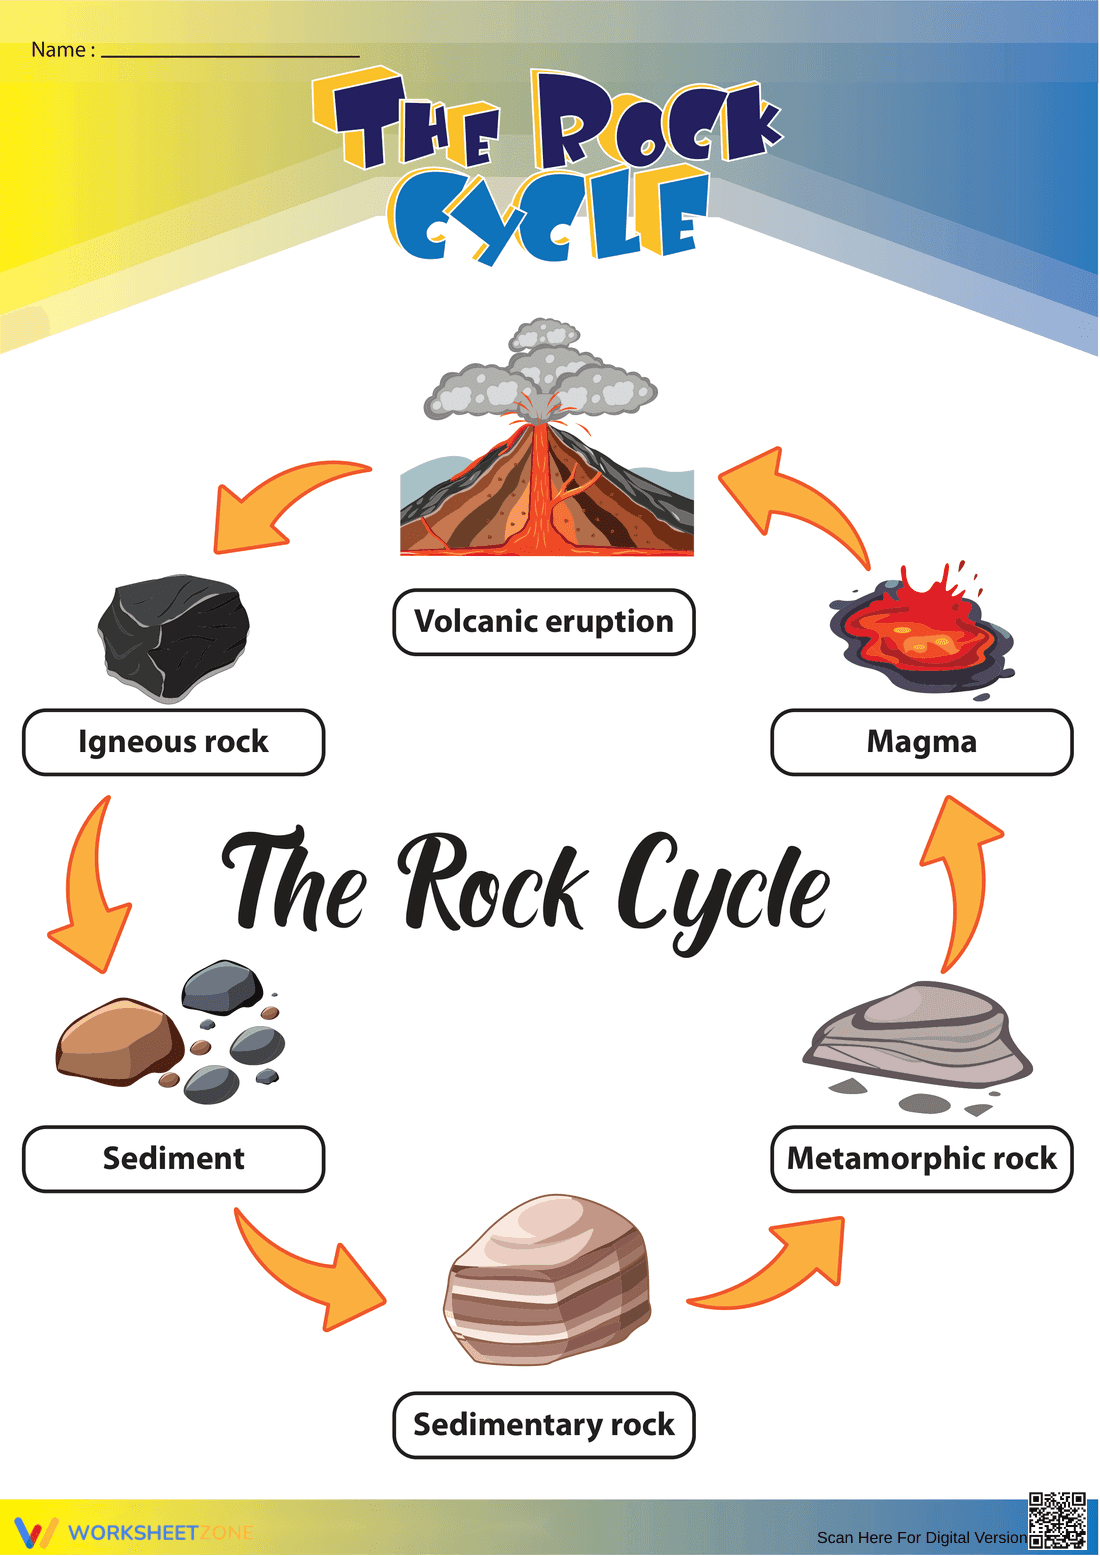
This Grade 4 science chart provides a clear, printable visual of the rock cycle, helping students grasp the continuous process of geological change. It illustrates the transformation between igneous, sedimentary, and metamorphic rocks. It's a perfect reference for student interactive notebooks and classroom anchor chart displays to support earth science units.
At a Glance
- Grade: 4 · Subject: Science
- Standard:
4-ESS1-1— Identify rock formation patterns to explain landscape changes and geological transformations- Skill Focus: The Rock Cycle
- Format: 1 page · 0 problems · Reference chart · PDF
- Best For: Interactive notebooks, anchor charts, and quick reference
- Time: 5–10 minutes
This single-page PDF contains a full-color, high-resolution diagram illustrating the complete rock cycle. It labels key stages: magma, igneous rock, sediment, sedimentary rock, and metamorphic rock. The vibrant illustrations and clear arrows make the cyclical process easy for students to follow, serving as a functional and visually appealing classroom reference tool for any science curriculum.
Zero-Prep Workflow
This resource is designed for maximum efficiency. Print (1 minute): Print the PDF as a poster or for individual use. Distribute (1 minute): Hand out copies for students to glue into science notebooks. Review (10 minutes): Guide students through the cycle or use it as a self-directed reference. Total prep time is under 2 minutes, making this chart ideal for sub plans or a quick lesson supplement.
Standards Alignment
This chart supports standard `4-ESS1-1`, requiring students to identify rock formation patterns to explain landscape changes. The diagram provides foundational knowledge of how these rock patterns form. It also prepares students for `MS-ESS2-1` concepts. Both standard codes can be copied directly into lesson plans, IEP goals, or district curriculum mapping tools to ensure instructional alignment across the earth science curriculum.
How to Use It
Introduce this chart to pre-teach essential vocabulary before a lab. For a quick formative check, ask students to trace the path from "sediment" to "igneous rock" and explain the steps. This reveals potential misconceptions about the process. The chart is an excellent scaffold for a gallery walk or station rotation activity during earth science rotations, with an estimated student engagement time of 10 minutes.
Who It's For
This resource is ideal for Grade 3 and 4 students. The visual layout is effective for English Language Learners and students with IEPs who benefit from non-linguistic representations. Pair this chart with a hands-on rock identification kit or a virtual field trip video to create a rich, multi-modal learning experience for every student in the classroom.
Understanding the rock cycle is a core component of Earth Science education, providing a framework for how landscapes change over geological time. This visual chart directly addresses standard 4-ESS1-1, which focuses on using rock patterns as evidence for these changes. By visually mapping the transformations between igneous, sedimentary, and metamorphic states, the resource provides students with a mental model for complex geological processes. According to Fisher & Frey (2014), non-linguistic representations are a powerful tool for building academic vocabulary and content knowledge, especially in science. This chart serves as a durable learning artifact that students can reference throughout a unit, reducing cognitive load and allowing them to focus on higher-order analysis, such as interpreting local geological formations based on the principles shown in the diagram. It makes an abstract concept concrete for young learners.


